Kashima's Office
ViewWave has a function to draw a report containing some graphs as mentioned in Subsection 3.4.6. There are three types of reports;
- Combination report: is a report contains some of present graphs. It can contain relation graphs and particle orbit graphs in addition to waveforms and spectra.
- Channel report: is a report contains waveforms and spectra of a single channel.
- Sensor report: is a report contains waveforms and spectra of a single sensor. A sensor consists of three channels of records sequentially stored.
ViewWave initially has four sample reports which are named;
- Acc, Vel, Fourier and pSv in A4: is a report similar with the report of ViewWave 1.xx.
- Acc and pSv of a sensor in line: is a sensor report containing acceleration waveforms and pseudo velocity response spectrum.
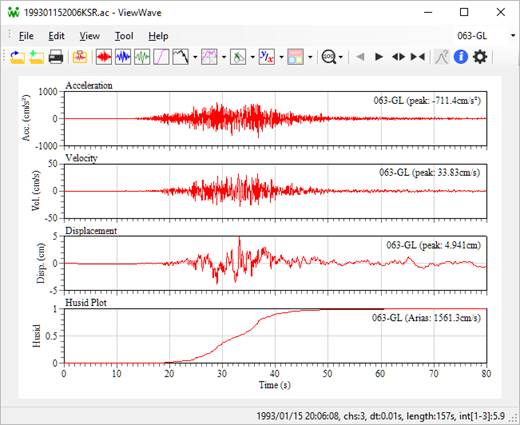
- Waves of a channel: is a channel report containing acceleration, velocity and displacement waveforms, and a Husid plot.
- Transfer Functions (Amp-Phase and Real-Imaginary): is a combination graph containing amplitude, phase, real part and imaginary part of the Fourier spectral ratio.
As a sample of the channel reports, the report [Waves of a channel] is shown below. If a channel report is selected, a dropdown textbox appears on the right side on the main menu in order to select a channel quickly.