Kashima's Office
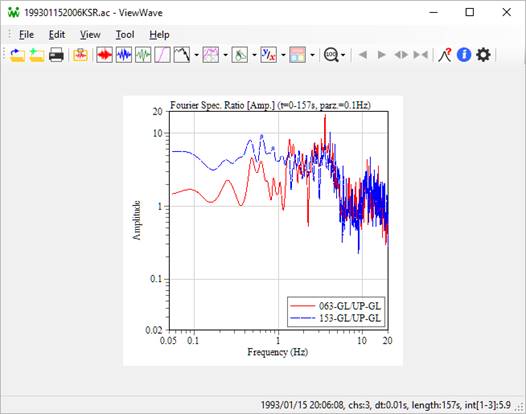
If there are two or more channels, ViewWave can analyze the relation of two channels of data. For example, amplitudes of the Fourier spectrum ratio between two channels can be plotted by choosing the menu [View] -> [Relation analysis] -> [Fourier spectrum ratio [amplitude]].
If two channels can be considered as input and output, the Fourier spectrum ratio represents the transfer function. The phase, real part and imaginary part of the Fourier spectrum ratio can be also selected from the [View] -> [Relation analysis] submenu.
Channels for the relation analysis can be set in the [Channel] tab in the [Option] dialog box. If the data file has a single channel data, the relation analysis is not available.